SsangYong Tivoli vs Toyota Vanguard
The Tivoli costs less to run, by the official figures: about £20 a year less in the UK.


Side by side
Specs are for each car's newest version. The better figure is in green.
A typical year's fuel
- United Kingdom
- £1,546 (better)
- £1,562
- New Zealand
- $2,545 (better)
- $2,571
- Australia
- $2,110 (better)
- $2,130
- United States
- $1,966 (better)
- $1,986
Official figures
- Uses
- 36 mpg (better)
- 36 mpg
- Also
- 7.9 L/100km (better)
- 8.0 L/100km
- On a full tank
- 371 miles
- –
Space
- Seats
- 5
- 7
- Boot
- 423 L
- –
- Length
- 4,225 mm
- 4,570 mm
Engine
- Engine
- 1.5 L 4-cylinder turbo petrol
- 2.4 L 4-cylinder petrol
- Power
- 120 kW
- 125 kW (better)
- Torque
- 280 Nm (better)
- 224 Nm
- Gearbox
- 6-speed automatic
- CVT
- Drive
- FWD
- AWD
A typical year: New Zealand 11,000 km (Ministry of Transport's average for a light vehicle); Australia 11,100 km (ABS Survey of Motor Vehicle Use average); United Kingdom 11,265 km (DfT National Travel Survey average of about 7,000 miles); United States 21,726 km (FHWA average of about 13,500 miles). Real costs depend on how and where you drive. Work out a particular trip.
Tivoli or Vanguard?
Which is cheaper to run, the SsangYong Tivoli or the Toyota Vanguard?
The SsangYong Tivoli: about £20 a year less in the UK than the Toyota Vanguard at today's average prices and a typical year's driving.
Which uses less fuel, the SsangYong Tivoli or the Toyota Vanguard?
The SsangYong Tivoli, at 7.9 L/100km (36 mpg UK, 30 mpg US) to the Toyota Vanguard's 8.0 L/100km (36 mpg UK, 30 mpg US), by their latest official figures.
Each on its own
Other comparisons
What will the drive cost?
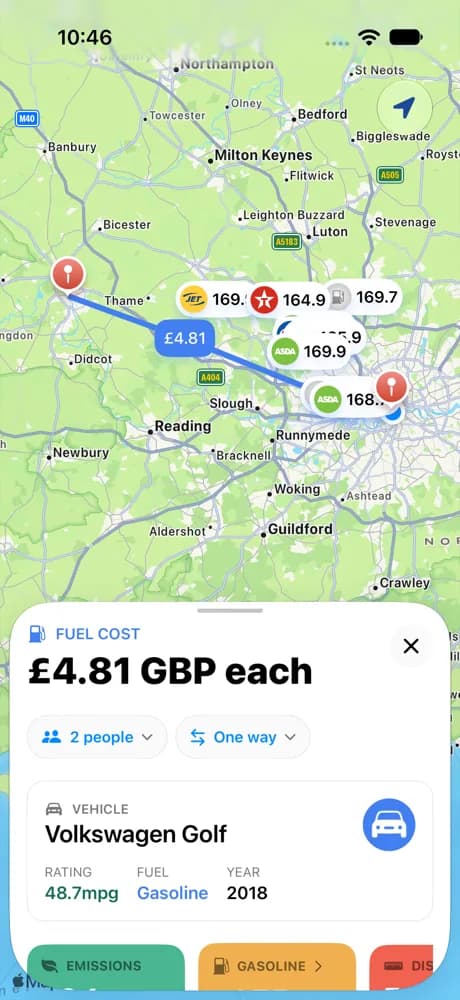
Roadtrip works out the fuel or charging cost of any drive for your exact car, finds the cheapest stations on the way, and splits it between everyone in the car.


Rated 4.7 by drivers · 700,000 downloads